| 2003 |

|
YEAR BOOK |
Institute of Technology Carlow
|
Democracy is not always the best method or rule!
|

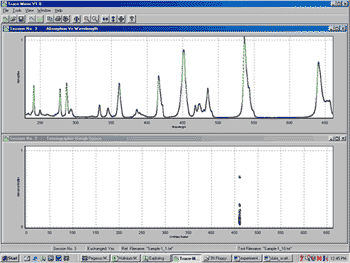
An example best illustrates the approach - The 'performance quality' of UV-visible spectrophotometers is established using Starna NIST (National Institute for Standards and Technology) standards. The wavelength is typically checked using a Holmium standard giving a spectrum with very sharp peaks occurring at wavelengths that are very accurately known (see Figure). It should be obvious from inspection of the data-scatter plot, produced by the analysis of two consecutive measurements of this standard, that an excellent visualisation of its performance has been obtained. In the case shown, the photometric reproducibility of the instrument is poor.
The advantage of the technique over the traditional is that it analyses the entire data set and all points here are scattered only in the photometric direction. It is thus visually obvious that the instrument has negligible wavelength errors and only measurable photometric errors. For instruments with wavelength reproducibility errors, the scatter would be expected to be in the opposite direction. For the instrument that has reproducibility errors in both its wavelength and photometric operation, loops are observed.
The Carlow software gives a numerical value for the average scatter of all the data points from the projection radius measurement, and secondly it provides a coherence angle measure, which allows the user to see immediately which of the two instrumental errors is the greater. If the angle is 0 degrees, then the data differ only in that there is wavelength scatter; if this angle is 90 degrees, then there are only photometric errors. It is important to point out that this technique can be used to monitor the performance of ANY instrument that produces a graphical output.
The simplest example of a non-democratic algorithmic approach is in the treatment of noise, which scatters into a central area beyond a specific projection radius determined by the root-mean-square noise value. Random noise scatter has been shown to follow a specific algebraic form in the data-scatter transform from a signal in a way that can be controlled to any level.
Contact: Dr Norman McMillan; Tel: 059 91 70554; E-mail: [email protected]